Introduction
Bitcoin’s options market delivered a fascinating shift this week, as the April 25 expiry closed with a strong upside surprise—defying the gravitational pull of the max pain level. In this edition, we dive into how macro fears shaped trader behavior, why the recent surge carried calls into the money across multiple expiries, and what an unusual move in implied volatility reveals about the current sentiment. We'll also take a close look at key on-chain signals, heatmap activity, and the latest positioning data, before spotlighting an interesting butterfly strategy targeting next week's expiry.
Let’s explore the signals and insights shaping the path ahead.
Explore these market dynamics firsthand with the Thales Options Strategy Simulator (OSS)
Market Snapshot
April 25 Expiry Recap
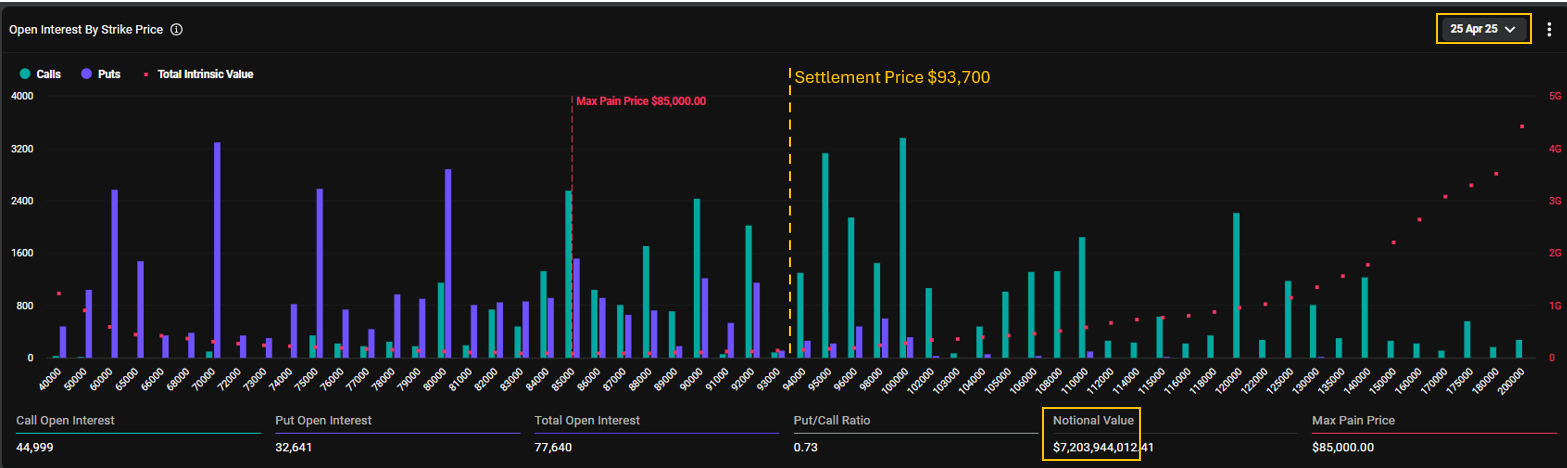
BTC settled at $93,700, well above the $85K max pain, with over $7B notional value and a Put/Call ratio climbing to 0.73.
April 25 marked one of the most significant expiries on the board, with over 77,000 open contracts and a notional value exceeding $7 billion. Despite a max pain level pinned at $85,000, Bitcoin surged into expiry at $93,700—well above max pain and notably away from recent expiry behaviors. This sharp move unfolded amid rising macroeconomic fears, particularly surrounding the escalating tariff war, which fueled uncertainty across global markets. The Put/Call ratio had recently climbed from more neutral levels (~0.5) to 0.73, reflecting a defensive tilt. However, many of the puts bought around the $70K–$80K strikes ultimately expired worthless, rewarding sellers. Meanwhile, call sellers at $85K–$90K likely faced unexpected losses as BTC’s late rally pushed numerous strikes into the money.
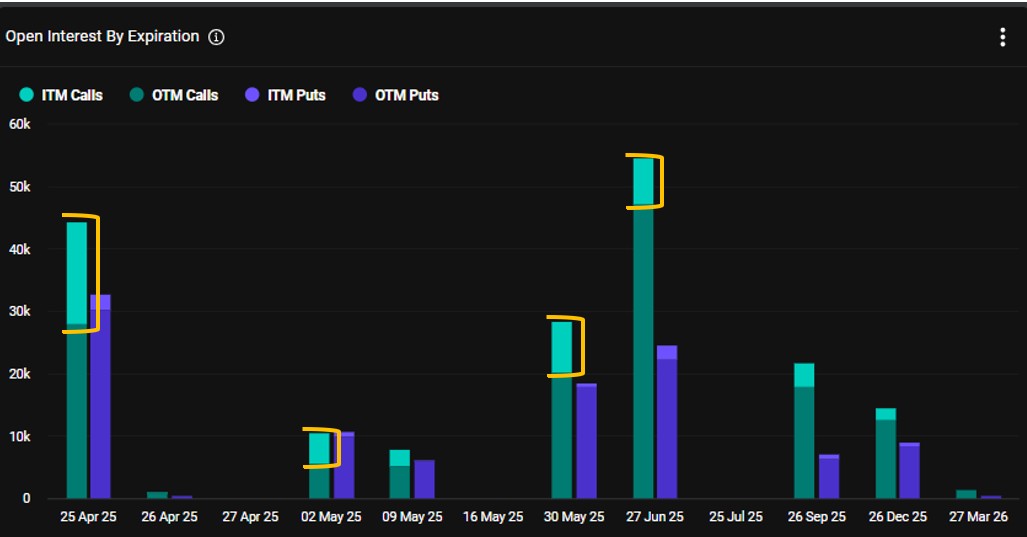
The recent Bitcoin rally pushed call options deep into the money across multiple expiries, notably May 2, May 30, and June 27.
The recent price surge didn’t just impact the April 25 expiry—it also pushed a noticeable portion of call options across other expiries into the money. As the chart shows, open interest bars for several maturities, such as May 2, May 30, and June 27, now display larger in-the-money (ITM) segments
A Bullish Confirmation from IV
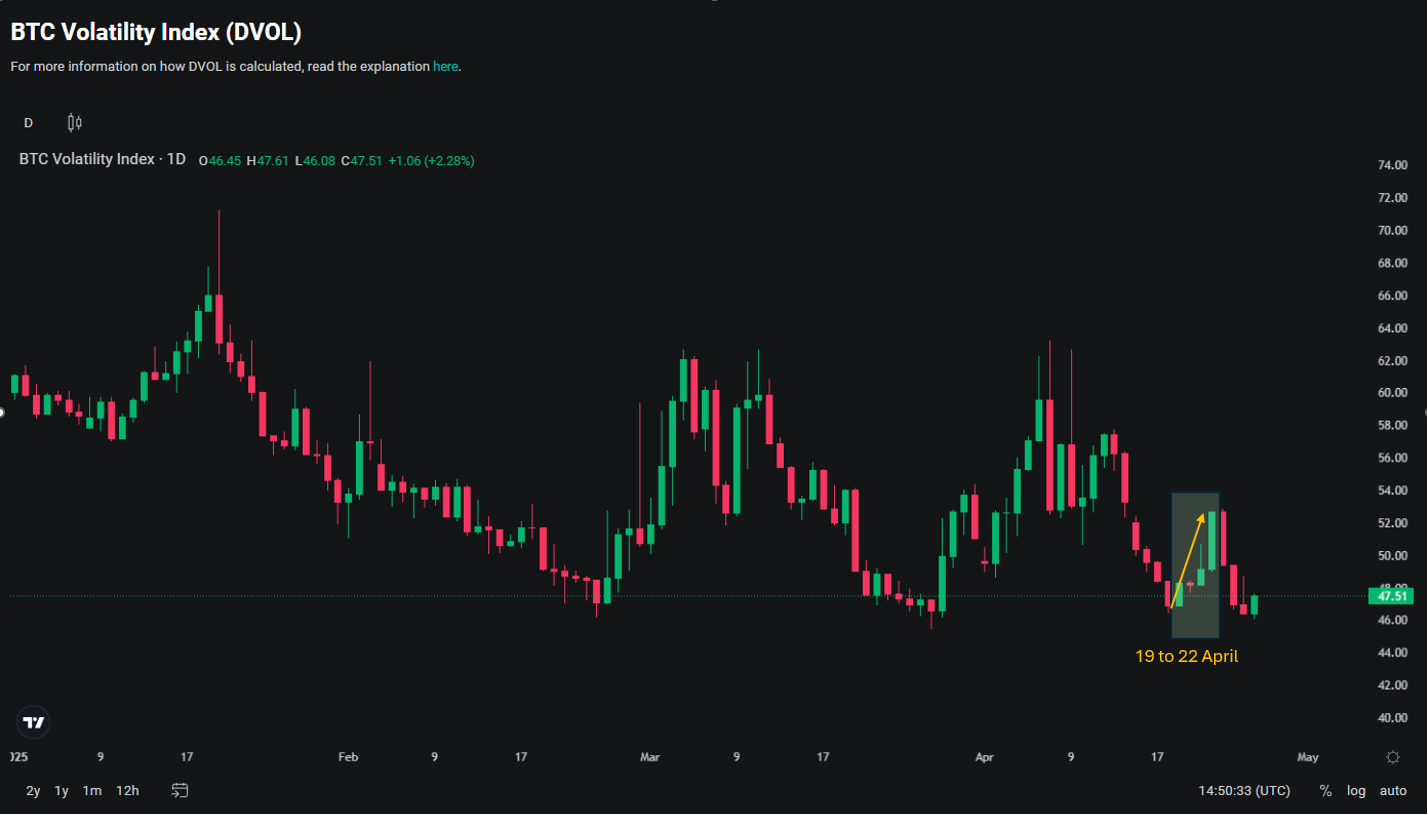
Between April 19 and 22, Bitcoin's implied volatility rose alongside price—a rare bullish confirmation not seen in recent months.
Interestingly, the implied volatility (IV) of Bitcoin options also rose alongside the price—a rare phenomenon lately. Since February, IV had typically moved inversely to Bitcoin’s price, but between April 19 and 22, this pattern broke. The uptick in IV during the price surge can be seen as a confirmation of the bullish move: it signals that the market grew increasingly concerned about further upside volatility, rather than calming down as prices rose.
On-chain: Short-Term Holders on a Pivotal Level
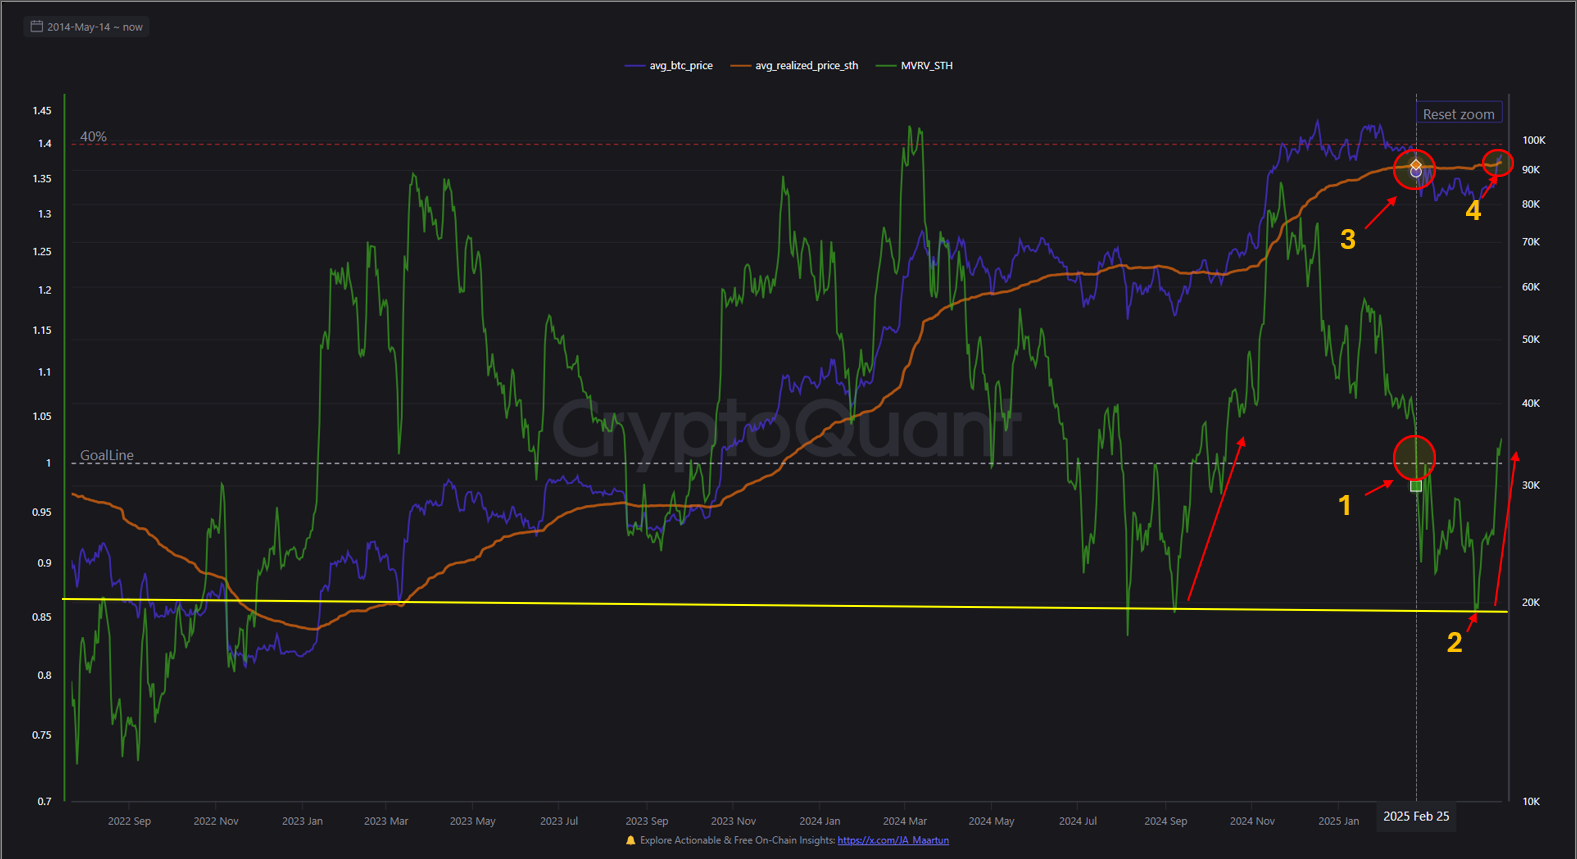
Bitcoin’s rebound from the short-term holders’ capitulation zone (~15% loss) pushed MVRV back toward 1.0, a pivotal level for sustaining bullish momentum.
The realized price of Bitcoin’s short-term holders (STH) remains one of the most reliable indicators for analyzing the behavior of players whose actions directly impact the market. In on-chain terminology, STHs are defined as those holding Bitcoin for less than six months—participants who, compared to long-term holders, are more sensitive to price fluctuations. Their reactions—whether driven by profits or losses—often create noticeable effects on market movements.
As illustrated in the chart above, on February 25, Bitcoin’s average market price (blue line) dipped below the average realized price of STHs (orange line), marked by point 3. Consequently, the MVRV ratio for STHs (green line) fell below 1.0 (point 1)—a critical psychological threshold. When STHs collectively move into a net-loss position, two reactions typically unfold: some capitulate around their breakeven, while others panic sell below it. If prices fall even further, the selling pressure gradually exhausts, as losses exceed many holders' pain tolerance.
Historically, when STHs reach a loss of around 13–15% (yellow line at point 2), selling pressure tends to fade, setting the stage for a potential rebound. True to form, Bitcoin rebounded sharply on February 22, pushing the MVRV ratio back toward 1.0.
Currently, STHs (on average) are hovering around their breakeven point once again. This level is crucial: if Bitcoin can decisively reclaim and stay above this threshold in the coming days or weeks, it could pave the way for a broader rally—or even the early stages of a new bull market. However, hesitation around this level could also lead to further consolidation or retracement.
Recent Activities
Thales Heatmap
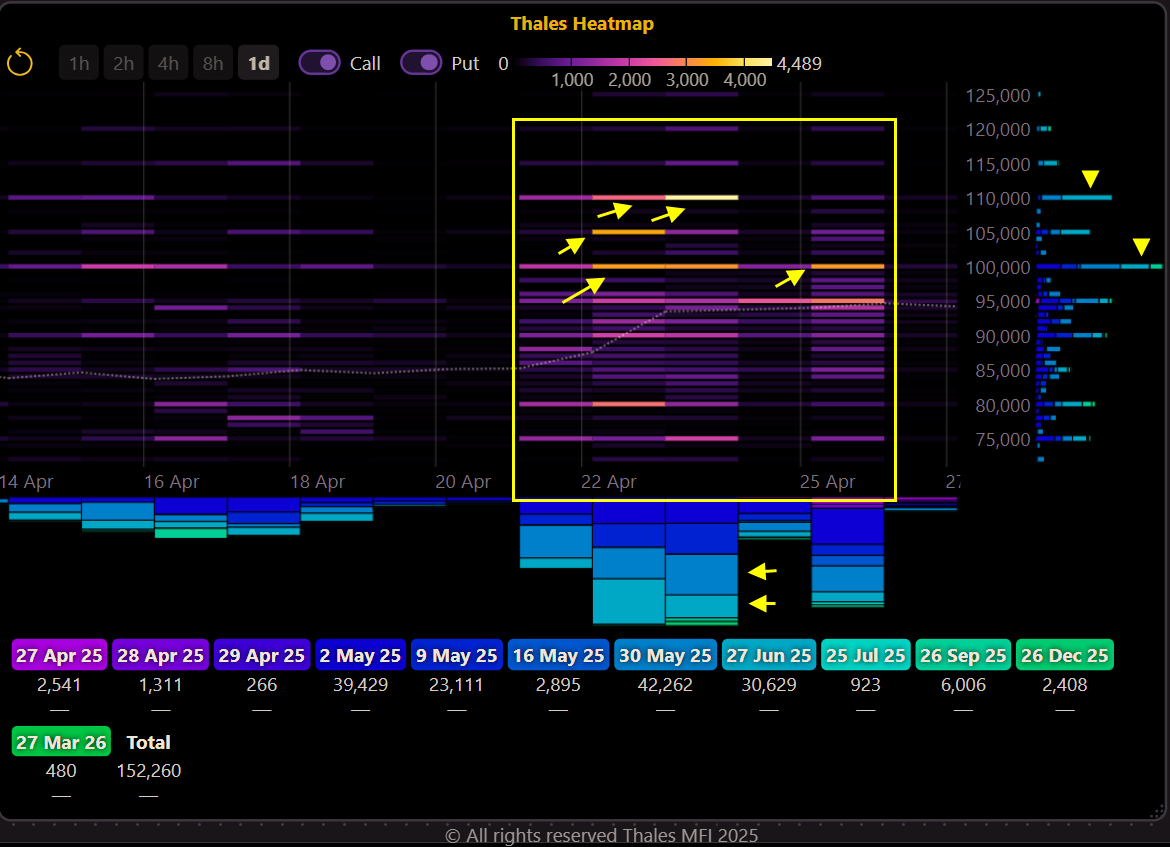
Between April 22–26, Bitcoin options traders focused on out-of-the-money calls at 100K–110K strikes, with notable activity for May 30 and June 27 expiries.
(OSS)
When it comes to capturing the recent pulse of Bitcoin options activity, few tools offer the clarity of Thales Heatmap. A quick glance reveals that from April 22 to April 26, traders concentrated heavily on slightly out-of-the-money (OTM) call options, particularly at the 100K, 105K, and 110K strike levels. These strikes sit just above the current Bitcoin price near $95K, suggesting that market participants are positioning for continued upside potential in the near term.
Market Screener
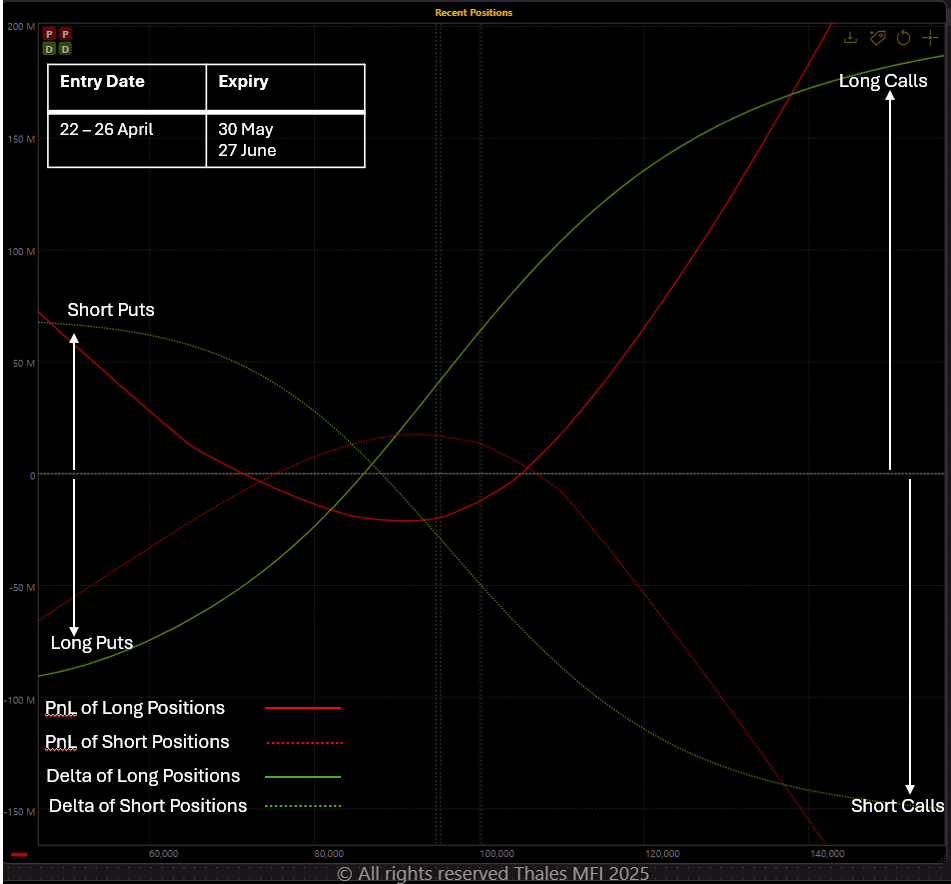
Recent flows show a bullish tilt, with notable long call positions outweighing puts for the upcoming 30 May and 27 June expiries.
(OSS)
After identifying from the Heatmap that most of the recent trading activity was concentrated around the 30 May and 27 June expiries, we turned to the Market Screener to better quantify these trades. Two filters were applied: entry dates between 22 to 26 April, and expiries limited to 30 May and 27 June.
The long side of the market (buyers, shown with solid lines) and the short side (sellers, shown with dotted lines) were overlaid on a single graph for direct comparison. In the chart, the red curves represent the aggregated PnL, while the green curves depict the aggregated delta.
The positioning shows that call activity—both long and short—was roughly double that of puts. The aggregated breakeven for calls sits around $106,000, while for puts it is near $74,000.
(OSS)
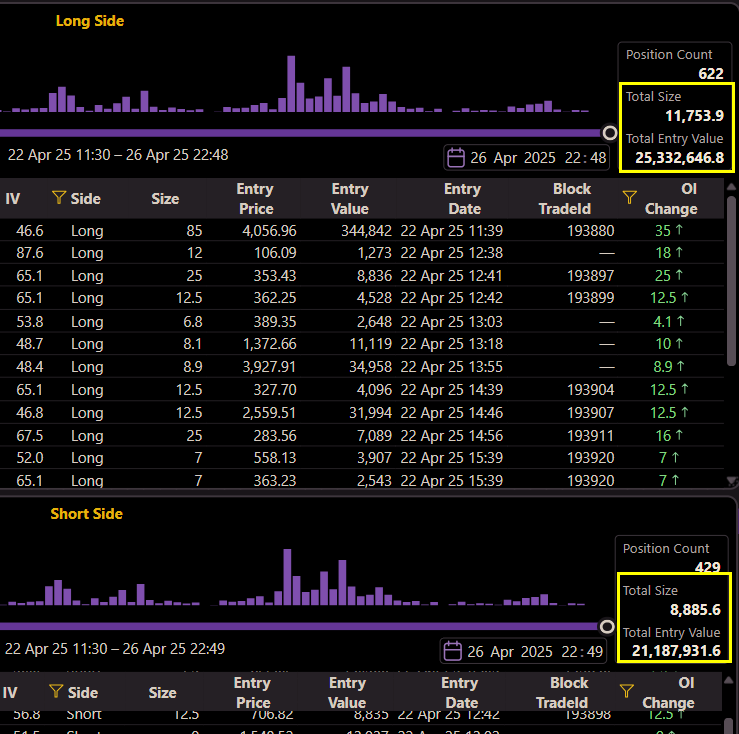
From a premium perspective, option buyers deployed more than $25 million across roughly 12,000 contracts, whereas option sellers collected over $21 million for less than 9,000 contracts.
Strategy Spotlight
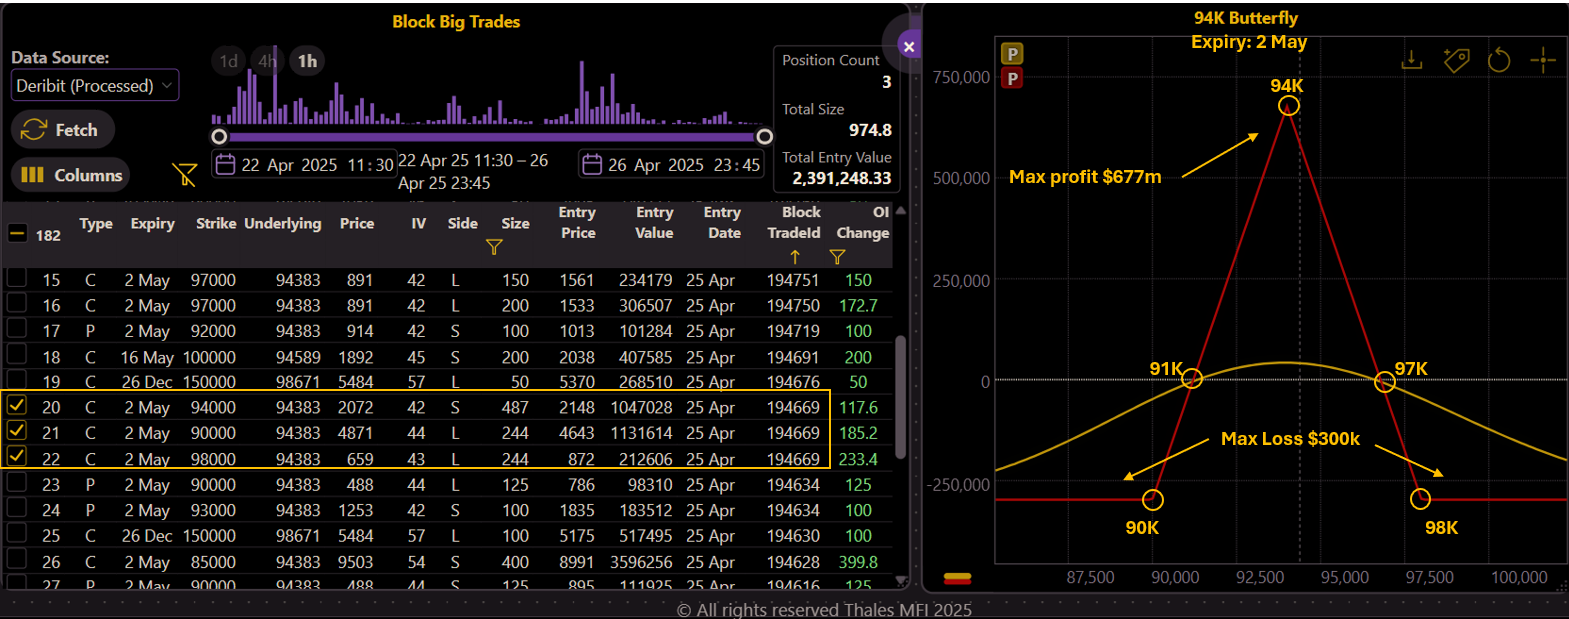
A classic 94K Long Call Butterfly was spotted for 2 May expiry, targeting $94K with breakevens at $91K and $97K, offering a $677K max profit versus a $300K max loss.
(OSS)
This week in our Strategy Spotlight, we observed a Long 94K Call Butterfly Strategy for the 2 May expiry.
As highlighted on the Market Screener, the structure consists of:
- Short 487 contracts at the 94K strike (at-the-money).
- Long 244 contracts each at the 90K and 98K strikes, forming the wings.
This is a classical butterfly strategy, designed to achieve maximum profit if Bitcoin settles precisely at $94,000 by expiry. The breakeven points for the trade are at $91,000 and $97,000, meaning the strategy will be profitable as long as Bitcoin closes within this range on May 2.
The maximum profit potential is an impressive $677K, while the maximum risk is contained at around $300K—reflecting the low-risk, high-reward nature typical of butterfly setups.
Overall, the positioning suggests that the trader expects BTC to hover between $91K and $97K, with an ideal pin at $94K by next Thursday’s expiry.
As always, we must wait and see—no guarantees.
Bottom Line
The April 25 expiry marked a significant shift in the Bitcoin options landscape, with a decisive break above max pain and a strong move into higher strike territory. Rising implied volatility, increasing in-the-money call positions, and critical on-chain support from short-term holders all suggest that the market is testing a key transition phase. While positioning now leans cautiously bullish, much depends on whether Bitcoin can sustain momentum above pivotal levels. As always, vigilance is essential—especially with major expiries and fresh macro risks still looming on the horizon.
Disclaimer
This report is for informational purposes only and does not constitute investment advice. All trading involves risk, and past performance is not indicative of future results. Readers should conduct their own research or consult a professional before making any investment decisions.